

发布者:Primerbank 时间:2017-09-25 浏览量:1158
Gyan Prakash Srivastava , Mamatha Hanumappa , Garima Kushwaha , Henry T. Nguyen , Dong Xu
Nucleic Acids Research, Volume 39, Issue 10, 1 May 2011, Pages e69,https://doi.org/10.1093/nar/gkr127
Published:16 March 2011 Article history
Abstract
To study functional diversity of proteins encoded from a single gene, it is important to distinguish the expression levels among the alternatively spliced variants. A variant-specific primer pair is required to amplify each alternatively spliced variant individually. For this purpose, we developed a new feature, homolog-specific primer design (HSPD), in our high-throughput primer and probe design software tool, PRIMEGENS-v2. The algorithm uses a de novo approach to design primers without any prior information of splice variants or close homologs for an input query sequence. It not only designs primer pairs but also finds potential isoforms and homologs of the input sequence. Efficiency of this algorithm was tested for several gene families in soybean. A total of 187 primer pairs were tested under five different abiotic stress conditions with three replications at three time points. Results indicate a high success rate of primer design. Some primer pairs designed were able to amplify all splice variants of a gene. Furthermore, by utilizing combinations within the same multiplex pool, we were able to uniquely amplify a specific variant or duplicate gene. Our method can also be used to design PCR primers to specifically amplify homologs in the same gene family. PRIMEGENS-v2 is available at: http://primegens.org.
Topic: polymerase chain reaction , genes, genes, duplicate , genome , protein isoforms, software, soybeans, stress
Issue Section: Methods Online
Alternative splicing is ubiquitous in plant and animal genomes. More than half of the human genes are known to have multiple isoforms (1,2). Alternative splicing plays many functional roles in signaling and expression regulation, e.g. calcium pump diversity, regulation of fibronectin, calcitonin and GTP cyclohydrolase I (3–6). It is also known to play significant roles in various human diseases like cystic fibrosis, Alzheimer’s disease (7), Parkinson’s and Frasier syndrome (8) and major cancers (9). In addition to mammalian systems, many reports have confirmed alternative splicing in plants. Some examples are light regulated alternative splicing of leaf hydroxypyruvate reductase (10), two isoforms of the serine–arginine-rich SR45 protein, each of which has distinct reproductive and vegetative function (11), and the NS and NLisoforms of the N gene, which encode a full-length protein and a truncated protein, respectively, in conferring complete resistance to the tobacco mosaic virus (12). In Arabidopsis, ∼42% of the intron-containing genes are estimated to be alternatively spliced (13). Based on earlier studies (14), this may also hold true for rice. Taken together, it is an evolutionarily conserved mechanism of posttranscriptional regulation, though not all splice variants may be biologically functional (15).
Despite the rising interest in studying the role of alternative splicing in inducing proteomic diversity, only few studies (16–20) have addressed isoform-specific expression profiling of alternatively spliced genes. The main reason for this is the difficulty in precise amplification of individual splice variant of a particular gene, especially when information about the gene’s isoforms is lacking. This bottleneck can be overcome by identifying their unique binding positions for primers with high specificity. First, such a design will enable a researcher to amplify isoform transcripts on a genome-wide scale using tools like quantitative real-time reverse transcription polymerase chain reaction (qRT-rtPCR/qRT-PCR). Second, it is applicable to duplicated genes in redundant genomes, common in agronomically important crops. Third, it bypasses a manual search for isoforms, making it an efficient, user-friendly and less error-prone process.
Similar issues are encountered in primer design for duplicate genes (paralogs). Paralogs are usually distinguished by designing highly specific probes and primers to target exons, designed one at a time to enable stringent cross-hybridization. Taking into account the prevalence of isoforms, there is also a need for a high-throughput approach to automate primer design for multiple genes/splice variants of any particular gene family in a genome. It should design a reliable set of primers for each variant with minimum undesired target amplification due to cross-hybridization. To address these issues, we enhanced our computational tool PRIMEGENS-v2 (21–23) to design homolog-specific primers within a gene family. This enhanced model can (i) design primer pairs that can uniquely amplify individual target genes in the presence of their paralogs and splice variants, and (ii) design multiplex primer pairs that can non-specifically amplify all splice and duplicate variants of a gene model.
A few other tools are available to detect splice variants and paralogs of a reference gene. These tools such as QuantPrime (24), Roche Applied Bioscience protocol (ProbeFinder assay design tool; http://www.roche-applied-science.com), Primer Premier (25), AlleleID (26), ExPrimer (27) and SpliceCenter (28), exploit the exon–exon junction through a prior knowledge of gene variants and duplicates. PRIMEGENS-v2 on the other hand is able to cover gene variants without any prior information of alternative spliced forms. It is thus useful in generating such information and then uniquely amplifying each variant in a large target set. In related work, some researchers (29) made use of mutations and indels present in introns of homologous genes to design primers specific to different genomes in allopolyploid species. This is a good approach to catalog sequence polymorphism and compare different genomes. In contrast, PRIMEGENS-v2 uses sequence polymorphism within the coding region to design specific primers for various forms of a gene, which can amplify the expressed sequences and profile functional differences among paralogs or transcript variants of a same gene. It avoids cross-hybridization of primers or non-target amplification with intronic region consisting of high-repeat regions or duplicated segments in a very large genomic sequence.
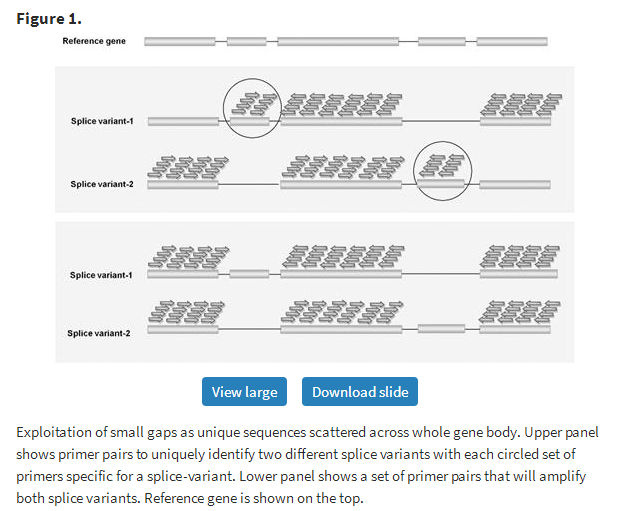
In order to design specific primers for very similar sequences, PRIMEGENS-v2 first uses the standalone executable of Primer3 (30). Primer3 is widely used to designPCR primers and oligonucleotide hybridization probes. In selecting small oligos for primers or hybridization probes, it considers many factors including oligo melting temperature, length, GC content, 3′-stability, estimated secondary structure, primer–dimer formation and the product size. Primer3 is used to design hundreds of primer pairs scattered all over the input query sequence in random. Designing multiple primers could be very useful when limited or no prior information about the presence of paralogs/splice variants is available. The main advantage of designing multiple primer pairs scattered all over the target sequence is the ability to exploit small gaps/indels in alignment in each splice variant as unique segments scattered across its whole gene body.
In case of closely related sequences like splice variants, some scattered primers (either forward or reverse primer) lie in the variable regions of paralogs/splice variants, which can uniquely amplify individual genes. Figure 1 shows two different cases of splice variants, where uniqueness of a single primer is used to amplify individual genes. In the upper panel of Figure 1, the first case shows the possibility of designing unique forward primer with common reverse primer whereas the second case uses a variable region to design unique reverse primer with common forward primer. This method will thus use small sequence differences among variants for their unique identification. In contrast, the lower panel shows a set of primer pairs that will amplify both splice variants indiscriminately.
Since primer binding is more critical at the 3′-end than at the 5′-end of a primer, PRIMEGENS-v2 selects 15-mer oligonucleotide segments from the 3′-end of each designed primer and retains only non-redundant ones from this set. This strategy reduces the run-time of the algorithm drastically as fewer BLAST (31) runs are executed, while no compromise is made in information retrieval.
The second step of PRIMEGENS-v2 is to perform gapless alignments of unique 15-mer oligonucleotides with all sequences in the soybean genome to find any region with potential non-specific PCR product. For this, PRIMEGENS-v2 uses Megablast (32) for alignment, which is optimized to detect genomic regions that are highly similar to 15-mer query oligos in database sequences provided. Parameters used for running Megablast for all oligos against the database were—W (word size) as 11, -F (filter query sequence) as F, i.e. false, -p (identity percentage cutoff) as 100% and -D (type of output) as 2. We assume that any single mismatch in these 15-mer oligos can prevent seeding of primers. Complexity filter (-F) to filter query sequence was made false in order to match entire oligo. We do not exclude any low-complexity regions defined by Megablast in the search for a more thorough cross-hybridization check. For the same reason, no E-value threshold was set.
As expected in highly redundant genomes like soybean, we observe hits of primer oligos of a forward primer functioning as a reverse primer in some other region due to gene duplication, inversion events or both. In other words, forward primer can act as reverse primer and vice versa, and amplify a completely different gene. Such Megablast hits further complicate the objective of finding specific primer pair for the target sequence and result in cross-amplification. Therefore, once primer pair design using Primer3 is accomplished and Megablast hits for each 3′-end unique oligo from both forward and reverse primers are recorded, PRIMEGENS-v2 pairs forward and reverse primers to check if they can produce potential amplicon by applying the e-PCR (33) algorithm for hybridization restriction. It first checks the occurrence of Megablast hit of any reverse primer near each Megablast hit for each forward primer on the same chromosome. Then, it checks the order and orientation of primer binding, which is essential to successfully amplify a sequence. In addition, even if the primer pair binds in correct order and orientation, the amplicon size should fall within the desired criterion. For example, a primer pair that shows cross-hybridization with amplification size of more than 10 000 nt other than the target region can safely be ignored, as it is not amplifiable. Figure 2 shows an example of primer oligo Megablast hit, which results in successful or failed amplification in PCR. As shown, out of four different cases of primer pair hits, only one case results in successful amplification. Furthermore, it amplifies only if the amplicon size is less than the maximum possible amplicon size (10,000 nt as the default in PRIMEGENS-v2) for RT–PCR.

Capability of PRIMEGENS-v2 to consider all potential amplifiable regions for each primer pair reveals all isoforms or paralogs for a gene or sequence. PRIMEGENS-v2 also calculates the exact product size of potential amplification across the genome. Primer pairs that amplify two different sequences with exactly same product size may be identified as exact duplicates, while product sizes of slightly different lengths can correspond to different paralogs or isoforms. Primer pairs amplifying other regions that are neither homologs nor splice forms i.e. cross-hybridization are presented if there is no way to avoid them. This could be due to duplicated regions of significant length. Such a feature to alert the user is highly useful for redundant genomes.
After this step, the primer pair pool generated gets further reduced to retain only those primer pairs that result in potentially good amplicons with no or few cross-hybridization. Out of these final candidates, the top primer pair(s) having no or the least amplifiable primer-pair products in the whole genome is reported as the final output. Figure 3 shows the basic flowchart of major computational steps. Primer pair combinations can then be manually verified and selected based on the target gene attributes such as splice variants and duplicates. The design provides detailed information about all primers such as their start and end positions on query sequence; number, names and sizes of all potential amplicons; and melting temperatures and GC contents of both forward and reverse primers. Manual verification adds another layer of confidence but the user has the option of by passing this and instead selecting top primer pairs provided by PRIMGENS-v2. Selection can also be made based on the design purpose. For example, whether an isoform has to be uniquely amplified or a pool of isoforms needs to be amplified.


We used soybean (Glycine max L. Merr.) to test the efficacy of PRIMEGENS-v2. Soybean is a diploidized tetraploid, having undergone two large-scale genome duplication events ∼60- and 15-million-years ago. It is ∼1115 Mbp in size and is extensively segmented and reshuffled with repetitive sequences, capturing more than 66 000 gene-coding loci on 20 chromosomes (34–37). Many studies have identified the presence of extensive duplication in soybean genome. In one study, 90% of the hybridizing probes were shown to detect more than two fragments while nearly 60% detected three or more fragments (38). About 40–60% of soybean genome was found to consist of repetitive sequences using DNA–DNA renaturation or re-association kinetic analysis (39,40). We applied PRIMEGENS-v2 to design primers and profile transcripts from various gene families in soybean, of which the late embryogenesis abundant (LEA) family was tested in this study. We were able to retrieve 45 putative sequences including isoforms from the soybean genome (M. Hanumappa et al., unpublished data) from publicly available databases such as Phytozome (http://www.phytozome.net) and NCBI (National Center for Biotechnology Information, http://www.ncbi.nlm.nih.gov). Primer3 parameters within PRIMEGENS-v2 to design primer pairs for each gene were: product size of 80–150 nt; Tm range of 59.0–61.0°C with an optimal Tm of 60.0°C; primer length ranging between 19 and 23 nt with an optimal size of 20 nt and GC content of 40–60%. The designed primers were further manually verified and confirmed by running BLAST against Phytozome v4.0 prior to validation by qRT-PCR.
The profiling was conducted using SYBR® Green-based qRT-PCR with the ABI 7000 Sequence Detection System (Applied Biosystems, Forster City, CA, USA). Total RNA was reverse transcribed (iScript cDNA Synthesis Kit, Bio-Rad, Hercules, CA, USA) and PCR performed on cDNA in 96-well MicroAmp Optical plates (Applied Biosystems) under the following conditions: 10-min denaturation and enzyme activation at 95°C, followed by 40 cycles of 95°C for 15 s and 60°C for 1 min. A 30-min post-amplification dissociation protocol was conducted to assess primer specificity and product uniformity. During this step, products are slowly heated to 95°C and fluorescence measurements are used to determine the melting point of the product. Amplification can be affected by the abundance of transcript in a tissue at a given developmental stage in addition to the treatment that the plant is subjected to. Here, RNA was extracted from 1-week-old seedlings under five different abiotic stress conditions at three time points with three biological replications. Each assay-well contained ∼12.5 ng of reverse transcribed RNA and 250 nM of each primer. To eliminate genomic DNA contamination, samples were treated with DNAse (Ambion TURBO DNA-free kit, Applied Biosystems) prior to cDNA synthesis and first tested for some known transcript size in a semi-quantitative PCR. Below, we discuss one such treatment where the plants were irrigated with 100 µM solution of abscisic acid (ABA). Ten hours later, shoots were cut and frozen till RNA was extracted from three biological replications and used as the template for cDNA synthesis using standard procedures. Control plants were given water only.
We have used dissociation curves of PCR products to verify single product amplification and therefore, primer specificity. The curve also gives a rough estimate of transcript abundance. Dissociation peaks are sharp when the primer pair uniquely amplifies a single target gene, whereas double peaks represent isoforms where the user can choose to pool them. As our aim is to count different forms (both paralogs and alternative splicing) of a gene instead of differentiating a splice variant from a duplicate gene, the terms variant and isoform are used interchangeably to denote an additional form of a gene in the following.
The PRIMEGENS-v2 algorithm is implemented in ANSI C language with command line executable and as web server. The program uses two third-party executables, Primer3 and Megablast. It has been tested on Unix/Linux and Windows platform. On an average, it takes less than a minute to complete primer design for any sequence in the soybean genome database (Glycine max) along with checking for cross-hybridization against the Glycine max database on a typical Linux server. The software tool is available at: http://primegens.org, both as standalone tool and webserver. The stand alone tool uses FASTA formatted sequence files and a configuration file, where the user can specify various inputs, primer design specifications and algorithmic parameters. Also, it can check sequence hybridization against a customized sequence database or a publicly available full genome database.
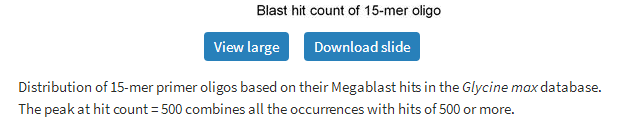
In order to estimate the complexity of finding sequence-specific primer pairs, we randomly chose approximately 26 000 15-mer oligos derived from more than 100 000 oligos designed as primer for various exonic regions from the soybean genome. The uniqueness of these 15-mer oligos was checked against the Glycine max database, which contains 77 778 sequences, using Megablast. Figure 4 shows the distribution of oligo hit counts on the Glycine max database, where vast majority of oligos show more than two hits, with only seven out of 26 331 hitting once and only 15 giving two hits. The peak in this plot corresponds to oligos that give 30–40 hits on the Glycine max database. The large number of hits is mainly due to genome complexity of soybean. Soybean genome is a product of an ancient genome duplication event and multiple neo-polyploid speciation events imposed on its paleopolyploid genome. In addition, gene loss, gene silencing and rearrangement of the genome like inversion or translocations along with duplication events (41,42) further made the genome more complex and gave rise to unusually high number of similar sequence fragments within its genome.

Next, after mapping back all unique 15-mer oligos to their original primers and applying hybridization rule to select the ones with putative amplicons (as shown in Figure 2), PRIMEGENS-v2 provided multiple primers for each gene in the LEA family.
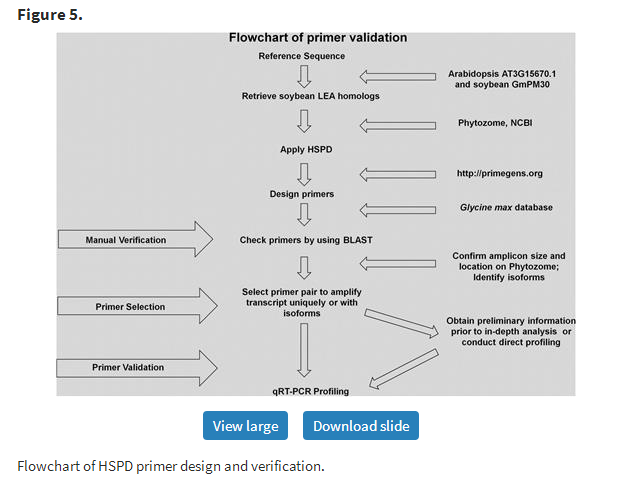
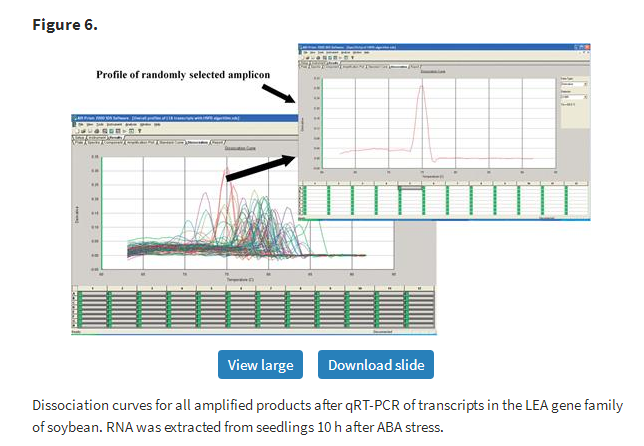
To experimentally validate the manually verified primers designed by PRIMEGENS-v2, qRT-PCR reactions using cDNA samples were conducted as described above. Figure 5 shows the basic flow chart of primer design, verification and validation steps. Isoforms identified were further tested using two sets of primers to uniquely amplify the isoform in one well and to amplify both the reference transcript and its isoform together in another well. In other words, the primer pair in the second well hybridized to a common region in the two sequences. This allowed us to compare the stringency of the primers by distinguishing the two forms rationally in the same PCR reaction. Though PRIMEGENS-v2 is capable of designing primer pairs common to more than two isoforms, we chose to amplify a maximum of two in a single reaction for ease of comparison and to avoid primer limitation. Figure 6 shows the dissociation curve for all amplified products of the LEA gene family in the soybean genome under the ABA stress condition using primers designed by PRIMEGENS-v2. A curve showing a single dominant peak represents unique product amplification. The profiling results show that while some primers designed by PRIMEGENS-v2 were able to amplify the isoforms together, some others could uniquely amplify each variant and homolog separately, as intended.
In this article, we present primers designed to amplify PM18 (Glyma03g34680), a member of the LEA family, as evidence for primer stringency, accuracy and specificity, as designed by PRIMEGENS-v2. Figure 7 shows two sets of primer pairs represented in green and red for PM18 gene. One of these primer pairs (shown in green) loaded in well B3 was capable of amplifying both splice variants of the gene PM18 (PM18.1 and PM18.2; Glyma03g34680.1 and Glyma03g34680.2), while another primer pair (shown in red) in well B2 could uniquely amplify PM18.1. The curves represent two wells that use different primer sets for the two PCR reactions on cDNA synthesized from the control and ABA stressed samples. A smaller peak at a lower Tm in Figure 7A is a result of very low transcript abundance. In Figure 7B, where primers were designed to detect more than one form as represented by the green curve, the peak is still sharp, with a second peak at a lower temperature. This second peak is easily distinguishable from that in Figure 7A due to its height, which is directly related to the abundance of the amplicon. From this, we can conclude that PM18.1 has very low expression in Figure 7A and that its expression is enhanced when the plant is stressed with ABA (as seen in Figure 7B). However, PM18.2 expression in stress is comparable to that in the control. By comparing between Figure 7A and B, we can clearly rule out primer dimerization as a result of low transcript abundance in Figure 7A. Taken together, the curves genuinely reflect transcript profiles and hence, primer specificity.
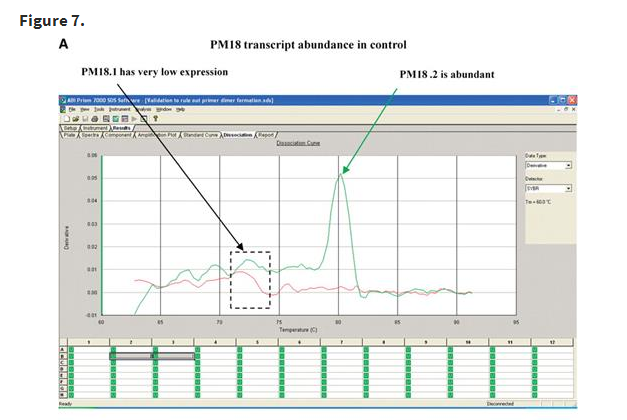
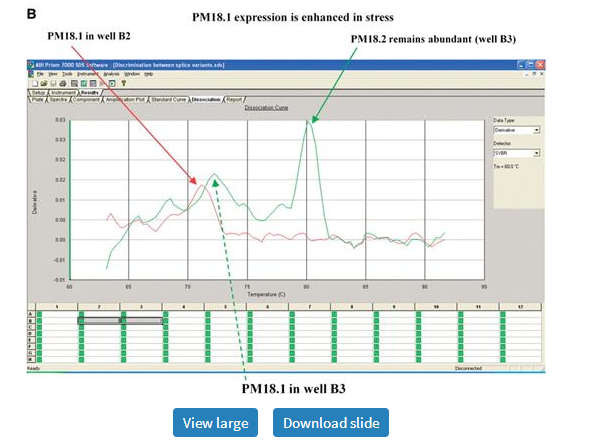
Dissociation curves for PM18 transcript in the control and ABA-treated samples showing primer specificity. Red and green curves represent amplicons generated by two different sets of primers. (A) PM18.2 is abundant in the control condition (green arrow). The small, red and green peaks in the dashed box indicate comparatively low abundance of PM18.1. (B) Both PM18.1 and PM18.2 are expressed in the ABA-treated samples. Curves represent amplicons derived from primer pairs designed to amplify PM18.1 (red arrow) alone in well B2 or both PM18.1 (dotted green arrow) and PM18.2 (solid green arrow) in well B3. The similarity of PM18.1 peaks within (A) or within (B) indicates primer stringency.
To further validate primer specificity and confirm the capability of PRIMEGENS-v2 to pick a unique region to amplify a specific transcript and a common region to amplify multiple transcripts, we searched these two primer pairs against the Glycine max database. Figure 8A and B shows how PRIMEGENS-v2 precisely picked the unique region of transcript-1 of PM18 (Glyma03g34680) for its unique amplification and common region for the isoforms. The sequence information shows that gene PM18 (Glyma03g34680), located in Gm03: 42 027 662–42 029 006 bp region, has its primary transcript Glyma03g34680.1 that contains one exon between 42 028 575 and 42 029 006 bp in contrast to its alternate transcript Glyma03g34680.2 with the same exon at 42 028 596–42 029 006 bp. On aligning the two primer pairs, we found that PRIMEGENS-v2 picked 20 nt from the exact unique 21 nt region between 42 028 575 and 42 028 795 bp of PM18.1 (Glyma03g34680.1) for primer pair-1 to uniquely amplify PM18.1 and common region for primer pair-2 to pool both isoforms, PM18.1 and PM18.2 (Figure 9).
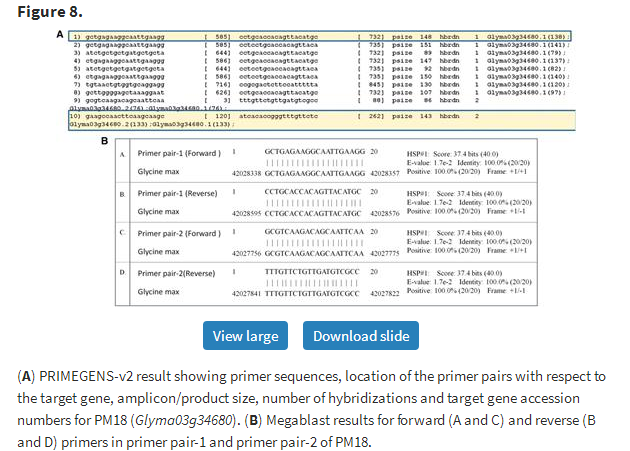
(A) PRIMEGENS-v2 result showing primer sequences, location of the primer pairs with respect to the target gene, amplicon/product size, number of hybridizations and target gene accession numbers for PM18 (Glyma03g34680). (B) Megablast results for forward (A and C) and reverse (B and D) primers in primer pair-1 and primer pair-2 of PM18.

Our result indicates a high success rate with all 45 primer pairs successfully amplifying specific transcripts or detecting two transcripts where we chose to. For ease of variant identification (Figure 6), two was the maximum number we chose to detect with a single primer pair though PRIMEGENS-v2 is capable of designing primer pairs to detect more than two isoforms. Finally, the primer pairs we designed were tested with samples derived from six conditions (five with stress and one control), at three time points and three biological replications, a total of 54 runs for each pair.
Our validation result indicates that primer design using PRIMEGENS-v2 is highly efficient and can be used in high-throughput primer design for large-scale profiling of transcripts in complex genomes. An expected product was always amplified in one or the other stress condition, thus confirming the validity of all primer pairs by ruling out poor sample quality. Although we did not conduct any gel electrophoresis or sequencing analysis of the amplicons to confirm that the products in wells B2 and B3 (Figure 7) are indeed PM18 transcripts, we are confident of our primer validation results for three reasons. First, as mentioned before, the primers designed by PRIMEGENS-v2 were manually verified by running BLAST against Phytozome v4.0, and the results always matched the gene orientation and accession number returned by the algorithm. This is further confirmed in Figure 8. Second, if an error is introduced during cDNA synthesis, it would be carried to both B2 and B3 wells within a qRT-PCR sample. If introduced during qRT-PCR—overriding the stringent primer design parameters set to prevent even a single mismatch at 3′-end—the error would be common to both wells in the control and stressed samples. Third, the comparison between the peaks in the two wells is further justified as the profiles within the samples are similar in both control and stressed RNAs.
By designing multiple scattered primers for a given query sequence, PRIMEGENS-v2 takes a large sample size (primer pairs) into account and attempts to cover all possible primer positions. This enabled us to exploit small regional or local variations amongst paralogs to amplify a specific transcript. Presence of various combinations of forward and reverse primer pairs was an added advantage in primer selection for amplifying all possible isoforms of a transcript. Though it may be counter intuitive to conduct hundreds of scattered primer pair design randomly and check for cross-hybridization, it is statistically more efficient in its run-time than an alternative approach of checking cross-hybridization first and then designing the primers, as our approach avoids computational search for isoforms and subsequent multiple sequence alignment of hits to find sequence-specific fragment for potential primers. The initial number of primer pairs designed is large, which is ultimately reduced by 30–50% due to selection of unique 15 nt from 3′-end. These resulting primers are further checked against the database with Megablast to remove primers resulting in cross-hybridization. Thus, the overall computing time for large-scale primer design using our method is relatively low. It takes only a couple of minutes to process each input sequence on a Linux server for the soybean database. Also, designing multiple sets of primer pairs for the query sequence enables our approach to check and account for the presence of unknown splice variants.
PRIMEGENS-v2 also allows rational utilization of wells in a reaction and is an efficient tool as the user has the option of pooling target candidates prior to in-depth analysis of each variant or paralog. Such specific primer design by PRIMEGENS-v2 will help biologists to conduct subsequent profiling using a subset of the primer pool to isolate differences within a group once they are established as transcripts of interest.
Funding for open access charge: United Soybean Board and the Missouri Soybean Merchandising Council.