发布者:primerbank 时间:2017-08-30 浏览量:923
https://doi.org/10.1186/1746-4811-8-34
© Liu et al.; licensee BioMed Central Ltd. 2012
Received: 15 June 2012
Accepted: 17 August 2012
Published: 24 August 2012
Abstract
Although Single Nucleotide Polymorphism (SNP) marker is an invaluable tool for positional cloning, association study and evolutionary analysis, low SNP detection efficiency by Allele-Specific PCR (AS-PCR) still restricts its application as molecular marker like other markers such as Simple Sequence Repeat (SSR). To overcome this problem, primers with a single nucleotide artificial mismatch introduced within the three bases closest to the 3’end (SNP site) have been used in AS-PCR. However, for one SNP site, nine possible mismatches can be generated among the three bases and how to select the right one to increase primer specificity is still a challenge.
In this study, different from the previous reports which used a limited quantity of primers randomly (several or dozen pairs), we systematically investigated the effects of mismatch base pairs, mismatch sites and SNP types on primer specificity with 2071 primer pairs, which were designed based on SNPs from Brassica oleracea 01-88 and 02-12. According to the statistical results, we (1) found that the primers designed with SNP (A/T), in which the mismatch (CA) in the 3rd nucleotide from the 3’ end, had the highest allele-specificity (81.9%). This information could be used when designing primers from a large quantity of SNP sites; (2) performed the primer design principle which forms the one and only best primer for every SNP type. This is never reported in previous studies. Additionally, we further identified its availability in rapeseed (Brassica napus L.) and sesame (Sesamum indicum). High polymorphism percent (75%) of the designed primers indicated it is a general method and can be applied in other species.
The method provided in this study can generate primers more effectively for every SNP site compared to other AS-PCR primer design methods. The high allele-specific efficiency of the SNP primer allows the feasibility for low- to moderate- throughput SNP analyses and is much suitable for gene mapping, map-based cloning, and marker-assisted selection in crops.
Single Nucleotide Polymorphisms (SNPs) are single base differences between DNA of different individuals. Once discovered, SNPs can be converted into genetic markers that can be assayed[1, 2]. As the most abundant and stabile form of genetic variation in most organism genomes, SNPs are more suitable for genotyping markers compared to the conventional markers such as RFLP (Restriction fragment length polymorphism), AFLP (Amplified fragment length polymorphism) and SSR (Simple Sequence Repeat). With the development of bio-technology, SNPs are becoming favored genetic markers that are used in marker-assisted breeding[3], map-based cloning[4], study of evolutionary conservations between different species[5, 6], and the detection of risk-associated alleles linked to human diseases[7].
Recently, massive parallel sequencing platforms such as GSFLX (Roche), Solexa (Illumina) and SOLID (Applied Bios stems) have significantly reduced the cost of high throughout sequencing[8]. A large number of genomes and transcriptomes have been rapidly sequenced using these new platforms to identify novel SNPs in maize[9], rapeseed[10] and human[11] etc. A large variety of techniques for high-throughput SNP genotyping have also been developed using Taqman[12], Amplifluor[13], genome re-sequencing[14, 15], and SNP arrays[16, 17]. These techniques are expensive and require specialized equipments, which cost more standard primers and are not practical for assaying low- to moderate-throughput SNPs. Hence, there is a need for simple and accurate genotyping assays that can be implemented in laboratories lacking access to sophisticated equipment.
Traditional SNP genotyping methods such as CAPs (The Cleaved Amplified Polymorphic Sequence), dCAPs (derived CAPS), and AS-PCR (Allele-specific PCR) are widely used for low-throughput applications in plant research. In application, CAPS and dCAPS are restricted by end nuclease sites that could be inefficient and not cost-effective[18, 19, 20]. AS-PCR is based on the extension of primer only when its 3’end is a perfectly complemented to the template[21]. In principle, SNPs can be detected using allele-specific PCR primers based on the 3’ terminal nucleotide of a primer that corresponds to a specific SNP site. However, reliable discrimination between the alleles is not sufficient to achieve using this described method. To overcome this problem, allele-specific primers with an additional base pair change within the three bases closest to the SNP site between alleles have been used[21, 22]. Each specific SNP site in an allele can generate at least 18 possible primers with one mismatch base[23]. The SNAPER program generates a list of up to 16 possible primers per SNP site for each allele[23]. Therefore, choosing additional mismatches to increase primer specificity has been a challenge for AS-PCR[23]. Some studies have proposed criteria for designing AS-PCR primers. Hayashi et al (2004) proposed that base pair mismatches created through T-G or C-A transversions at third base from 3’ end could increase the allele-specificity[24]. Hirotsu et al (2010) identified A-T transversion and A-G transition were useful base pair mismatches for improvement of allele-specific amplification[25]. The WASP tool could also be used to introduce mismatches at the penultimate (2nd to the terminal) base of the primer[26, 27]. However, most studies used only a limited quantity of primers, which might have some influences on efficiency of SNP primer specificity.
In this study, over 2000 primer pairs, which were designed based on SNPs between B. oleracea lines 01-88 and 02-12, were used to analyze the effects of different SNP types, mismatch bases and sites within the three bases closest to the 3’end on primer specificity. Based on these results, we advanced the SNP primer design principle. Compared to traditional SNP genotyping methods, our method could provide a cost-effective alternative for high efficient specific primers and would greatly facilitate plant research.
SNP analysis of B.oleracea 01-88 and 02-12 genome sequences
The assembly of genome sequences of B.oleracea line 02-12 has been accomplished (unpublished). To identify SNPs between B. oleracea lines 01-88 and 02-12, genome DNA of line 01-88 was re-sequenced and a total of 119 million reads were obtained. To get high-quality SNPs, the sequence data was subjected to stringent filtering: The reads from line 01-88 were compared to the sequences of line 02-12 using BLASTN. Sites containing tri-allelic or high degree of polymorphism were omitted. The sequences containing over 8 reads mapped to unique sites in the genome sequence were extracted from line 01-88. Pair wise alignment was used to evaluate the SNPs between genome sequences of 01-88 and 02-12. The alignment result revealed a total of 1,422,113 SNPs existed between B. oleracea lines 01-88 and 02-12 (an average of one SNP in every 360 bp fragment) (Table1). Analysis to the SNPs showed over half (56.7%, 806387/1422113) of the nucleotide changes were transitions (A-G or C-T). Transversions (A-T, A-C, C-G and G-T) accounted for 43.3% (615726/1422113) of the detected SNPs (Table1).
Table 1
Putative SNPs identified between B. oleracea genomes of 01-88 and 02-12
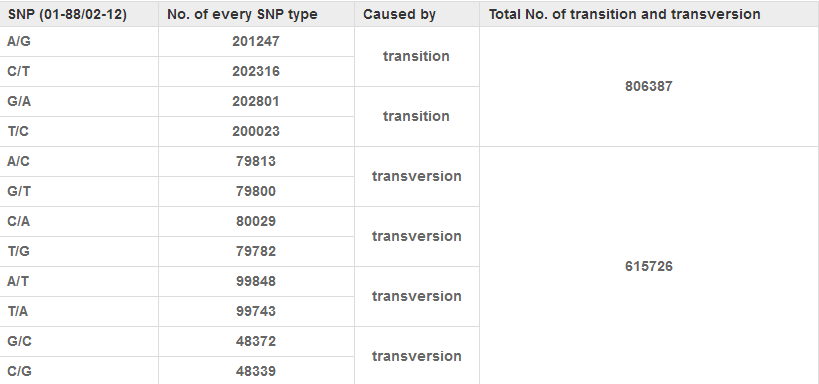
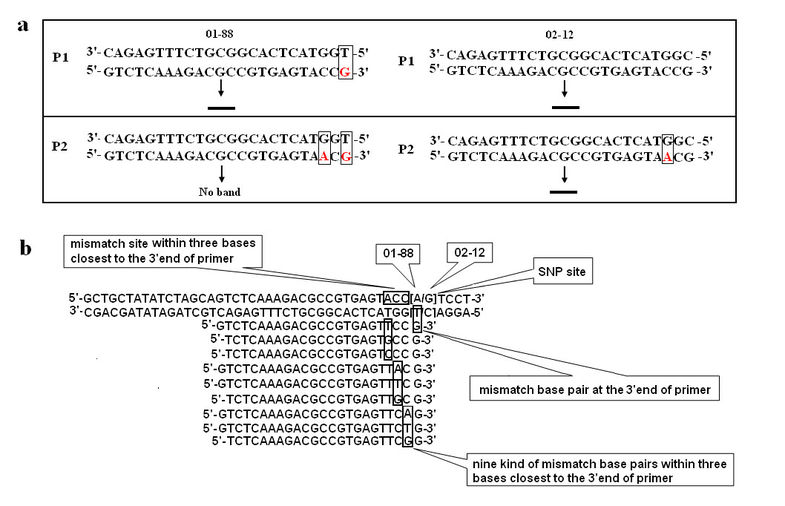
Figure 1
Schematic representation of the AS-PCR primer design. a, Primer P1 forms a perfect match with allele from 02-12, but a mismatch base pair at the 3’end with the DNA sequence of allele from 01-88. It could amplify the band in both of two lines 01-88 and 02-12. Primer P2 forms two mismatch base pairs with allele from 01-88 at the 3’end and in the 3rd nucleotide from the 3’end, while a mismatch base pair in the 3rd nucleotide with allele from 02-12. It amplified the band only in 02-12. b, Schematic representation of different mismatches during the SNP primer design.
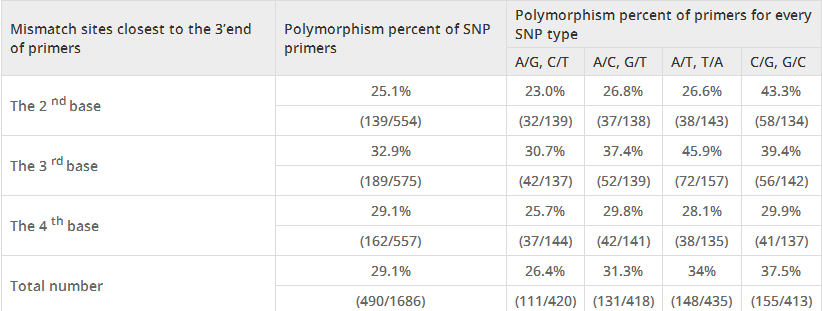
In this study, 1686 B. oleracea SNPs including 12 kinds of SNPs were chosen for primer design ( Additional file1). Among them, some of those SNPs could form the same 3’end mismatches in 01-88 with allele-specific primers. Therefore, all SNPs could be classified into eight kinds including A/G and C/T, T/C and G/A, A/C and G/T, T/G and C/A, A/T, T/A, C/G, G/C (Table2) based on mismatch types (for example, for SNPs A/G and C/T, the 3’ end mismatch of the allele-specific primer designed for 02-12 is TG in 01-88). Moreover, for convenience of data analysis, we further compressed into four SNP types including A/G (T/C), A/C (T/G), A/T (T/A) and G/C (C/G) based on their destabilization effects in mismatch base pairs (Table2)[28, 29].
Destabilization strength of eight combinations of mismatch nucleotide pairing

In this study, all the primers were used to amplify the genome DNA of lines 01-88 and 02-12, and PCR products were detected on 2.5% agarose gel by electrophoresis. The results showed that among the 1686 primer pairs, 490 pairs (29.1%) displayed polymorphism (Table3). When classified by SNP types, the percents of polymorphism of A/G (C/T), A/C (G/T), A/T (T/A), C/G (G/C) were 26.4% (111/420), 31.3% (131/418), 34% (148/435) and 37.5% (155/413) respectively. When classified by mismatch sites, polymorphism percents of the 2nd, 3rd and 4th base location closest to the SNP sites were 25.1% (139/554), 32.9% (189/575) and 29.1% (162/557), respectively. If SNP type and mismatch site in primers were both considered, the polymorphism percent of SNP A/T (T/A) which had mismatches in the 3rd site was 45.9% (72/157), followed by C/G (G/C) in the 2nd site with 43.3% (58/134) and 3rd site with 39.4% (56/142). The polymorphism percent of SNP A/G (C/T) was 26.4% (111/420), which also has the lowest polymorphisms in all mismatch sites.
Effect of mismatch sites and SNP types on the specificity of allele-specific PCR
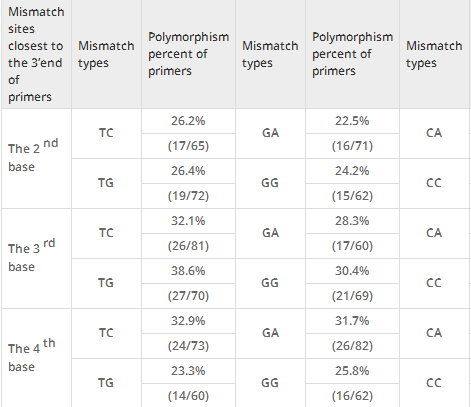
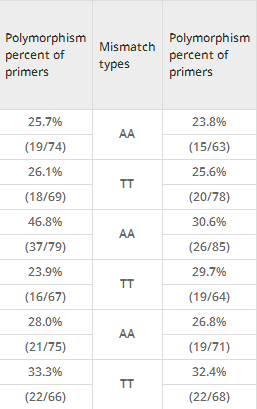
Moreover, the polymorphism percents of SNP primers classified by the types of mismatch bases in the 2nd, 3rd and 4th mismatch sites were analyzed (Table4). Results showed that polymorphism percents of 8 mismatch types were closely equivalent in the 2nd sites (22.5%-26.4%). High polymorphism percents appeared in two mismatch base pairs in the 3rd base location (CA, 46.8%, 37/79; TG, 38.6%, 27/70). At the 4thbase away from the SNP site, the polymorphism percents of primers with mismatch base pairs GA, TC, TT and CC were over 30% (31.7%-33.3%).
Table 4
Effect of artificial base mismatches in three mismatch sites on the specificity of allele-specific PCR
Based on the results in Table3 and Table4, we inferred that primers, which had CA mismatch in the 3rd base closest to SNP site A/T (T/A), had the highest polymorphism between lines 01-88 and 02-12. To identify this conjecture, 385 primers designed from SNP A/T (T/A), which contained G or T base in the 3rd nucleotide, were further chosen for polymorphism analysis ( Additional file2). The detection results showed that 295 SNP primers were polymorphic (295/385, 76.6%) between lines 01-88 and 02-12. When these primers were classified based on the SNPs (A/T or T/A) in 3’end, the specificity percent of SNP (A/T) (158/193, 81.9%) was higher than that of SNP (T/A) (137/192, 71.4%) (Figure2a and Figure2b).
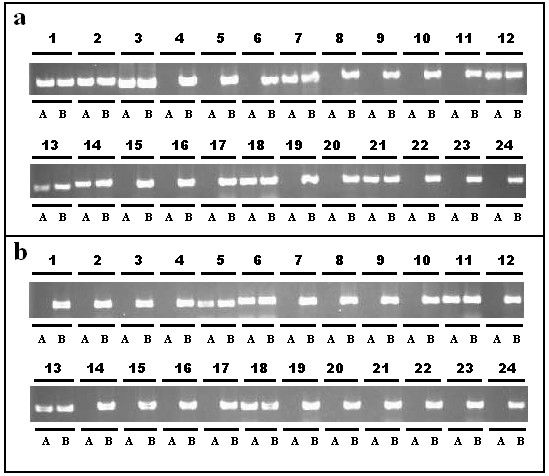
Figure 2
Analysis of specificity for SNP primers of B. oleracea . a, 1-24 primer pairs, which corresponded to Bo001-Bo024, were introduced with a CA base pair mismatch in the 3rd nucleotide closest to 3’end (A/T SNP type, AA mismatch). b, 24 primer pairs, which corresponded to Bo194-Bo217, were introduced with a CA base pair mismatch in the 3rdnucleotide closest to 3’end (A/T SNP types, TT mismatch). A, 01-88; B, 02-12.
Besides the highest polymorphic primers mentioned above, the high polymorphic primers could be found in every SNP type based on our results. The principle of primer design is described as followed: firstly, for every kind of SNP, the mismatch site (the 2nd, 3rd and 4th site closest to the SNP site) is chosen according to the result of polymorphism percent in Table3. For the primers of three SNP types A/T (T/A), A/C (G/T) and A/G (C/T), the highest polymorphism percents are 45.9%, 37.4% and 30.7%, respectively and the mismatches in primers are all located in the 3rd site. While for the SNP type C/G (G/C), the mismatches in the 2nd site closest to 3’end of primers show highest polymorphism percent (43.3%). For the base in mismatch site (the 2nd, 3rdand 4th site closest to the SNP site), there exist three different mismatch styles for every kind of base. The best mismatch style is chosen according to the statistical results from Table4. For example, if there is a G in the 3rd site, the mismatches of CC, CA and CT will be formed. The polymorphism percent of primers with CA (46.8%) mismatch is highest compared to that of CC (23.9%) and CT (32.1%).
20 primers pairs designed according to SNPs between rapeseed zy036 and 51070

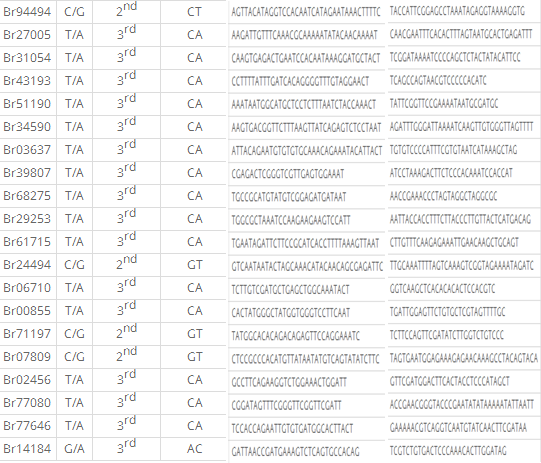
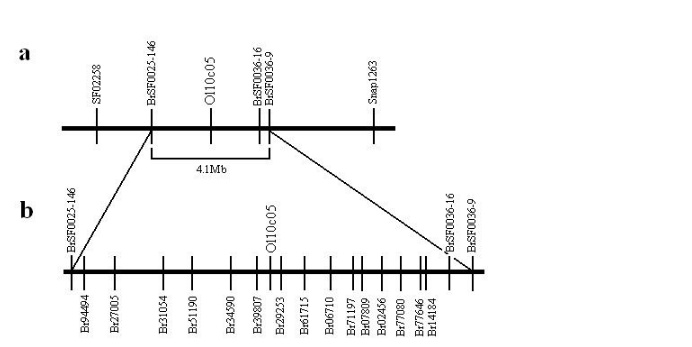
Figure 3
SNP marker density increase of rapeseed linkage map. a, An oil content QTL was scanned between O110C05 and BrSF000036-9. b, Among twenty primers, fifteen new makers were generated for further QTL location.
In recent years, various methods for high-throughput SNP analysis have been described[28]. Although these methods are highly efficient compared to other traditional SNP genotyping by electrophoresis, significant investments of expensive probes, microchips or special instrumentation have limited their use in most laboratories. For traditional low-throughput SNP genotyping methods, the main time and labor, and low efficiency of specific primer are still challenges[27]. The Allele-specific PCR method was developed for allele analysis of clinically significant mutations. To facilitate reliable discrimination between two alleles highly, the addition of artificial mismatches within the three bases from 3’end of the primers might be beneficial[23]. Although the third position from the 3’end has been detected as the best to place a mismatch base in primer previously[24], we really do not know which kind of mismatch (for every base, there are three kinds of mismatches) is the best choice in the 3rd position. In this study, different from the previous reports which used only a limited quantity of primers, a large amount of SNP primers designed by introducing mismatches within the three bases closest to the 3’end of primers were used to solve this problem.
Generally, AS-PCR primers designed randomly had a low allelic specificity rate of approximately 30%, which was consistent with our results (29.1%). However, mismatch sites (2nd, 3rd, and 4th site closest to the 3’end) had different effects on the polymorphic efficiency of primers. In our study, we found primer polymorphic percent was lowest in the 2nd base location because many primers could not amplify any bands in both of the lines 01-88 and 02-12. For the 4th base location, the polymorphism efficiencies of all mismatch types were almost equivalent (under 30%). The highest polymorphic percent was found in the 3rd base located closest to the SNP site, which was observed by Hayashi et al similarly (2004)[24].
According to the results of thermodynamics of mismatches reported by Peyret et al (1999) and Little (2001)[28, 29], the mismatch base pairs had different destabilization effects that could be divided into weak, medium, and strong strength of destabilization. Therefore, during design of AS-PCR primers, the effects of mismatches no matter in 3’end or within the three bases closest to the 3’end of primers should be both considered[26, 27]. In this study, for convenient analysis, we compressed four SNP types including A/T (T/A), A/G (T/C), A/C (T/G), and G/C (C/G) based on their destabilization effects of mismatch base pairs formed in 3’end of primers. Among them, primers generated from SNP types A/G (T/C) had the lowest detection efficiency in all mismatch sites. It was reasonable because AC and GT mismatches had weak destabilization strength. The primers including these specific mismatches at 3’end were easier to make amplification in both alleles.
Similarly, mismatch types within the three bases closest to the 3’end affect specificities of primers. In the 3rdbase, CA and TG (the highest polymorphic mismatches) belonged to weak destabilization strength mismatches. The mismatches GA, TC, TT, and CC (the higher polymorphic mismatches) located at the 4th base away from the SNP site belonged to the strong destabilization strength mismatches. From the results, we deduced that SNPs (A/T), which contained CA mismatches in the 3rd nucleotide from the 3’ end of the primers, had the highest allele-specification. According to the combination rules, polymorphic efficiency between TT (mismatch in 3’end of primer, strong destabilization strength) and CA (weak destabilization strength) are typically higher than AA (mismatch in 3’end of primer, medium destabilization strength) and CA. Our results confirmed this deduction.
Based on these results, we performed the primer design principle which could form the one and only best primer for every SNP type. Among them, mismatches in the second positions were more appropriate for SNP type (C/G and G/C), which was different from the viewpoint that mismatch in the 3rd position was the best choice for AS-PCR. With the primer design principle, we further tested the primers designed based on SNPs of rapeseed and sesame. High efficient polymorphism of the primers identified the usability of the method in other species.
A SNP primer design method was developed which improved the polymorphism efficiency of AS-PCR primers highly. The modified primer design can help to identify the best effective primer for each SNP and potentially is a valuable tool for gene mapping, map-based cloning and marker-assisted selection in crops.